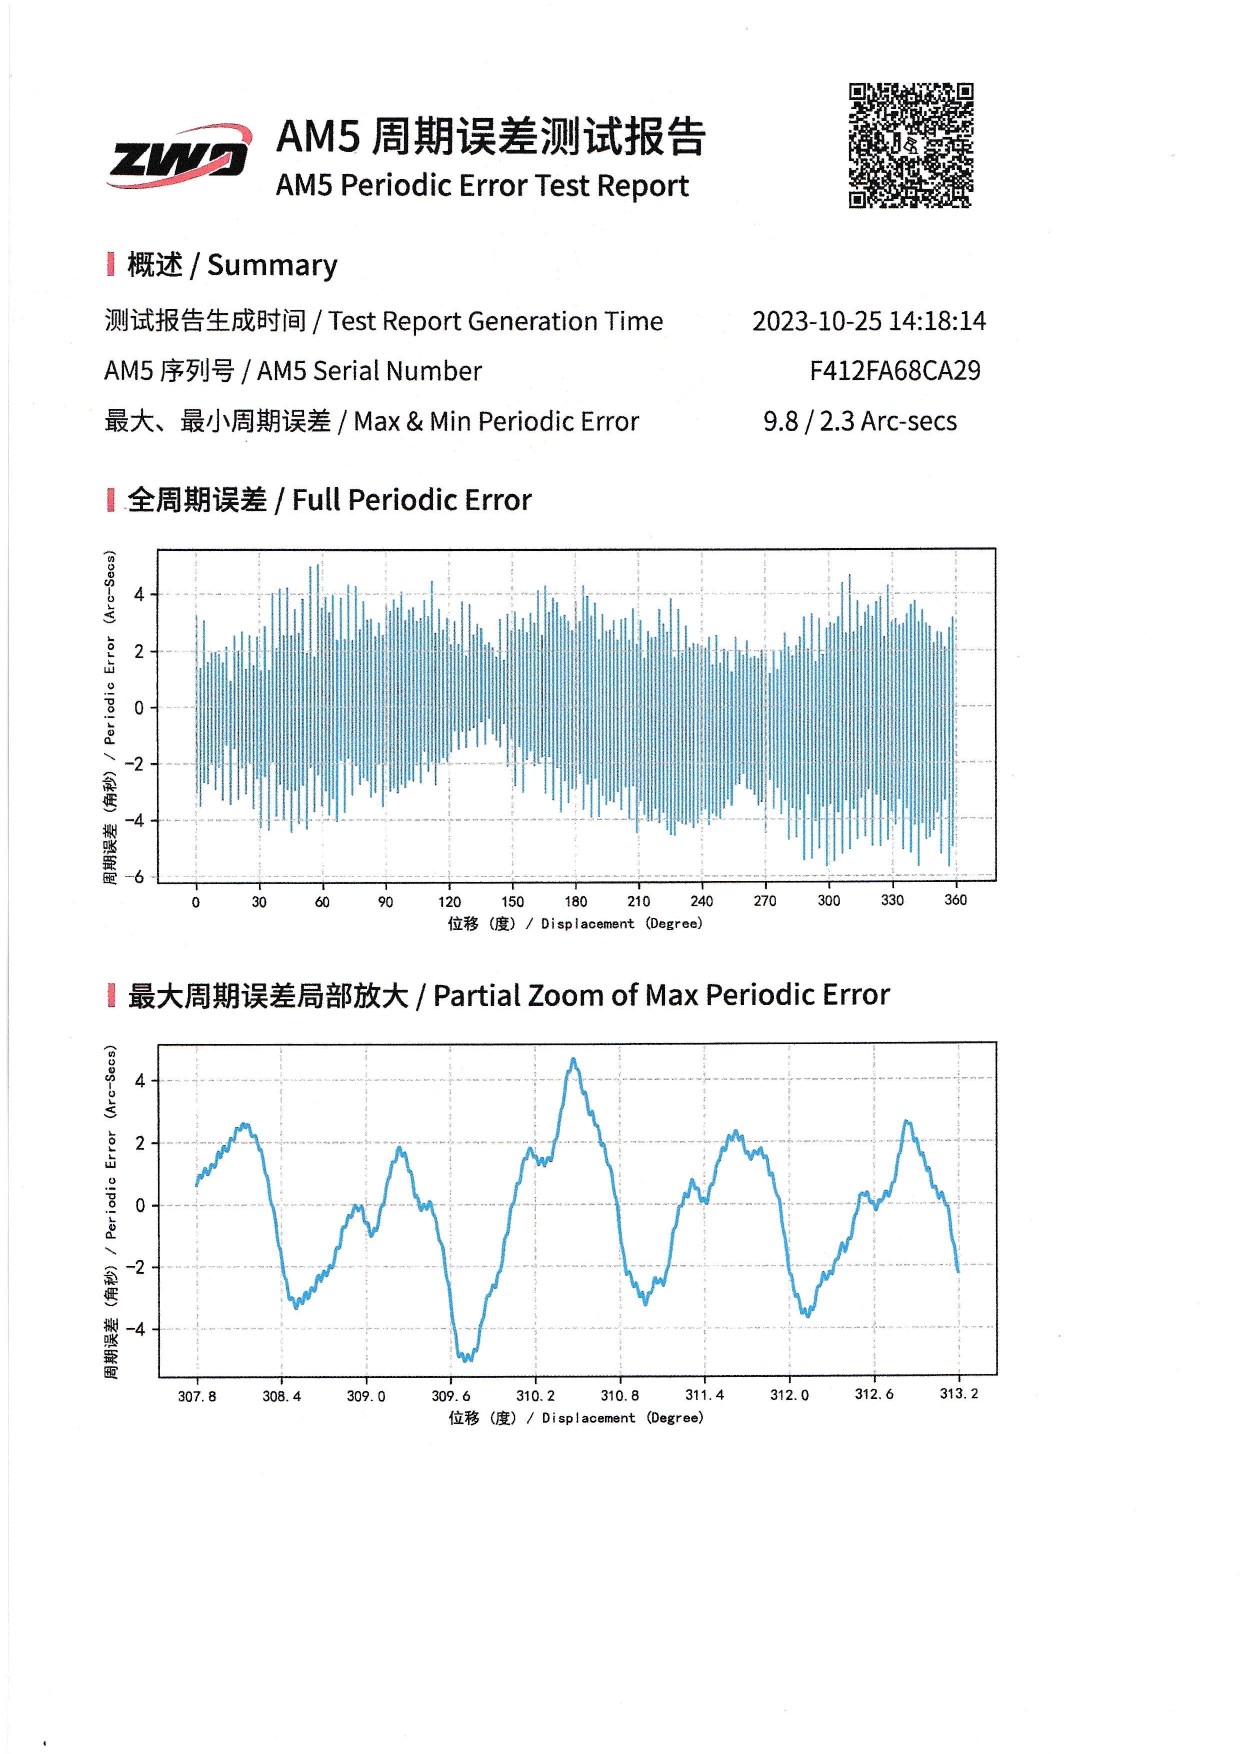
Hello Chen @w7ay ,
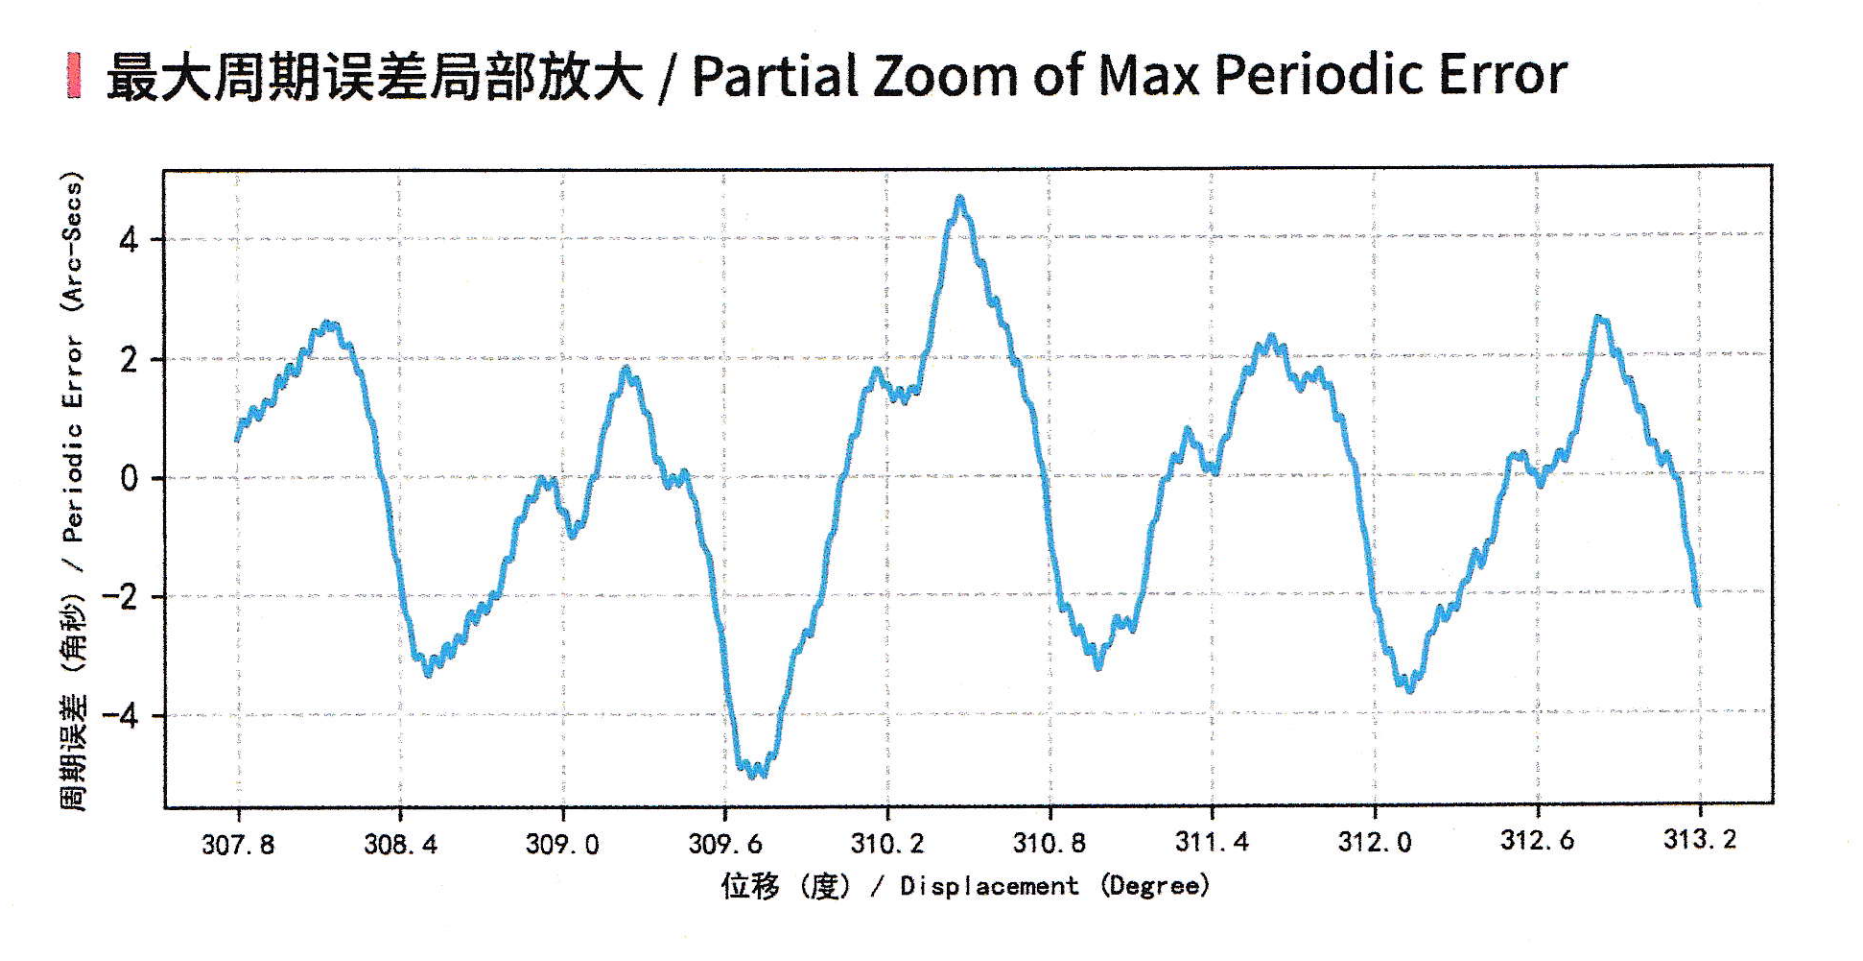
would you be so kind and help me to analyze how my graph of the PE has to be interpreted if it is a good sample or not? How to calculate the crucial things like first derivative on this chart and how to interpret the result and the curve characteristics?
I would be very grateful if you could help me. Maybe guide me in some directions on important phd2 guide settings related to this curve, like as you have done it with other user's am5 chart. I recently bought the mount and I am going to do a guiding test on the weekend, but a mathematical interpretation would be very interesting!
I already sampled some data points (A1, A2...... L1, L2, take a look at the picture) with a PlotDigitizer, so you can take these values for the next calculation steps. The data points are sampled at positions where I tought a steep slope exists.
Data-Points:
Structure: Point (x, y)
A1 (308.2496608, 1.745958849)
A2 (308.4510926, -2.99307059)
B1 (309.1835719, 1.339491822)
B2 (309.0696308, -0.78521895)
C1 (309.2690278, 1.616628047)
C2 (309.3870385, -0.129330168)
D1 (309.4480784, 0.073903346)
D2 (309.6535795, -4.831408673)
E1 (310.1561419, 1.773672471)
E2 (309.7736248, -4.646650627)
F1 (310.4633761, 4.692840561)
F2 (310.3046723, 1.468822624)
G1 (310.7258479, 1.20092371)
G2 (310.8418238, -2.161661917)
H1 (311.173474, -0.794457106)
H2 (311.1042955, -2.540415321)
I1 (311.9201962, 0.212471458)
I2 (312.0015826, -2.207851851)
J1 (312.4899022, 0.286374169)
J2 (312.4288622, -1.016166086)
K1 (312.8174833, 2.6697457)
K2 (312.7401659, 0.785219373)
L1 (313.1084401, 0.018476101)
L2 (313.1898269, -2.115472828)
Note: Everybody else reading this is welcome to analyze the graph too! I would be very greatful.
Best Regards,
Ricco, Location: Vienna


