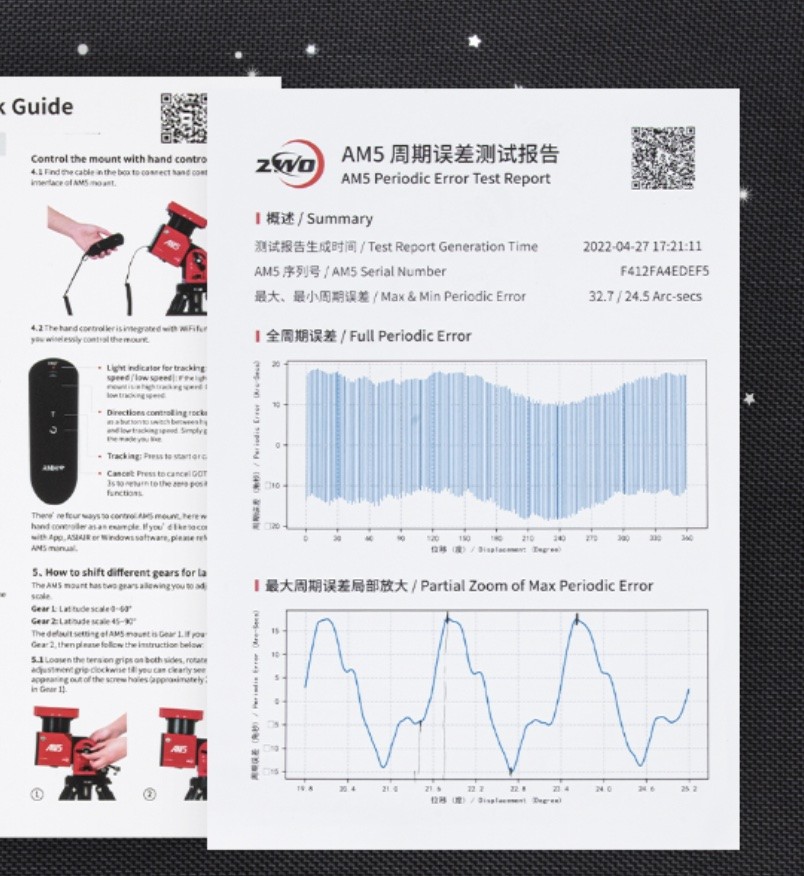
Kevin_A My mount PE error is 16.8/6.0 on RA but it seems to have a secondary harmonic in the graph too.
Many harmonics, not just second. A second harmonic would have looked like a fundamental sine wave where each half cycle is displaced up and down also in a sinusoidal motion.
It is too bad that ZWO does not provide numerical data for the PE curve, just some plots, otherwise we could take a Fourier transform and actually look at the harmonic content.
Notice in the second figure ("partial zoom") that you posted, the cycles don't even repeat. So there are even sub-harmonics present. The peaks of that last cycle is distinctly different from the previous two, and those two don't look perfectly alike either. This is characteristic of strain wave gears, and is caused mostly by the flexible (yep, flexible :-) spline gear component of the strain wave gear. The better machined the gears are, the more repeatable the cycles are. But there is always a slop.
Take a look at the GIF image in this wiki https://en.wikipedia.org/wiki/Strain_wave_gearing . The flexible spline gear is the red gear in the image.
This, by the way, is the reason why you cannot create a fixed periodic error correction (PEC) for strain wave mounts. People are clamoring for PEC, without understanding that it simply is not mathematically possible ("unmöglich", or as the Japanese engineers put it... "verrrrry difficult") to use a single cycle to correct. (You can use some predictive methods, but then, you might as well just guide a strain wave mount the way they need to be guided -- with rapid guide updates).
Since there is no numerical data, we will just bypass the harmonic analysis and just wing it and estimate the worst case slopes directly from the figures as best we can.
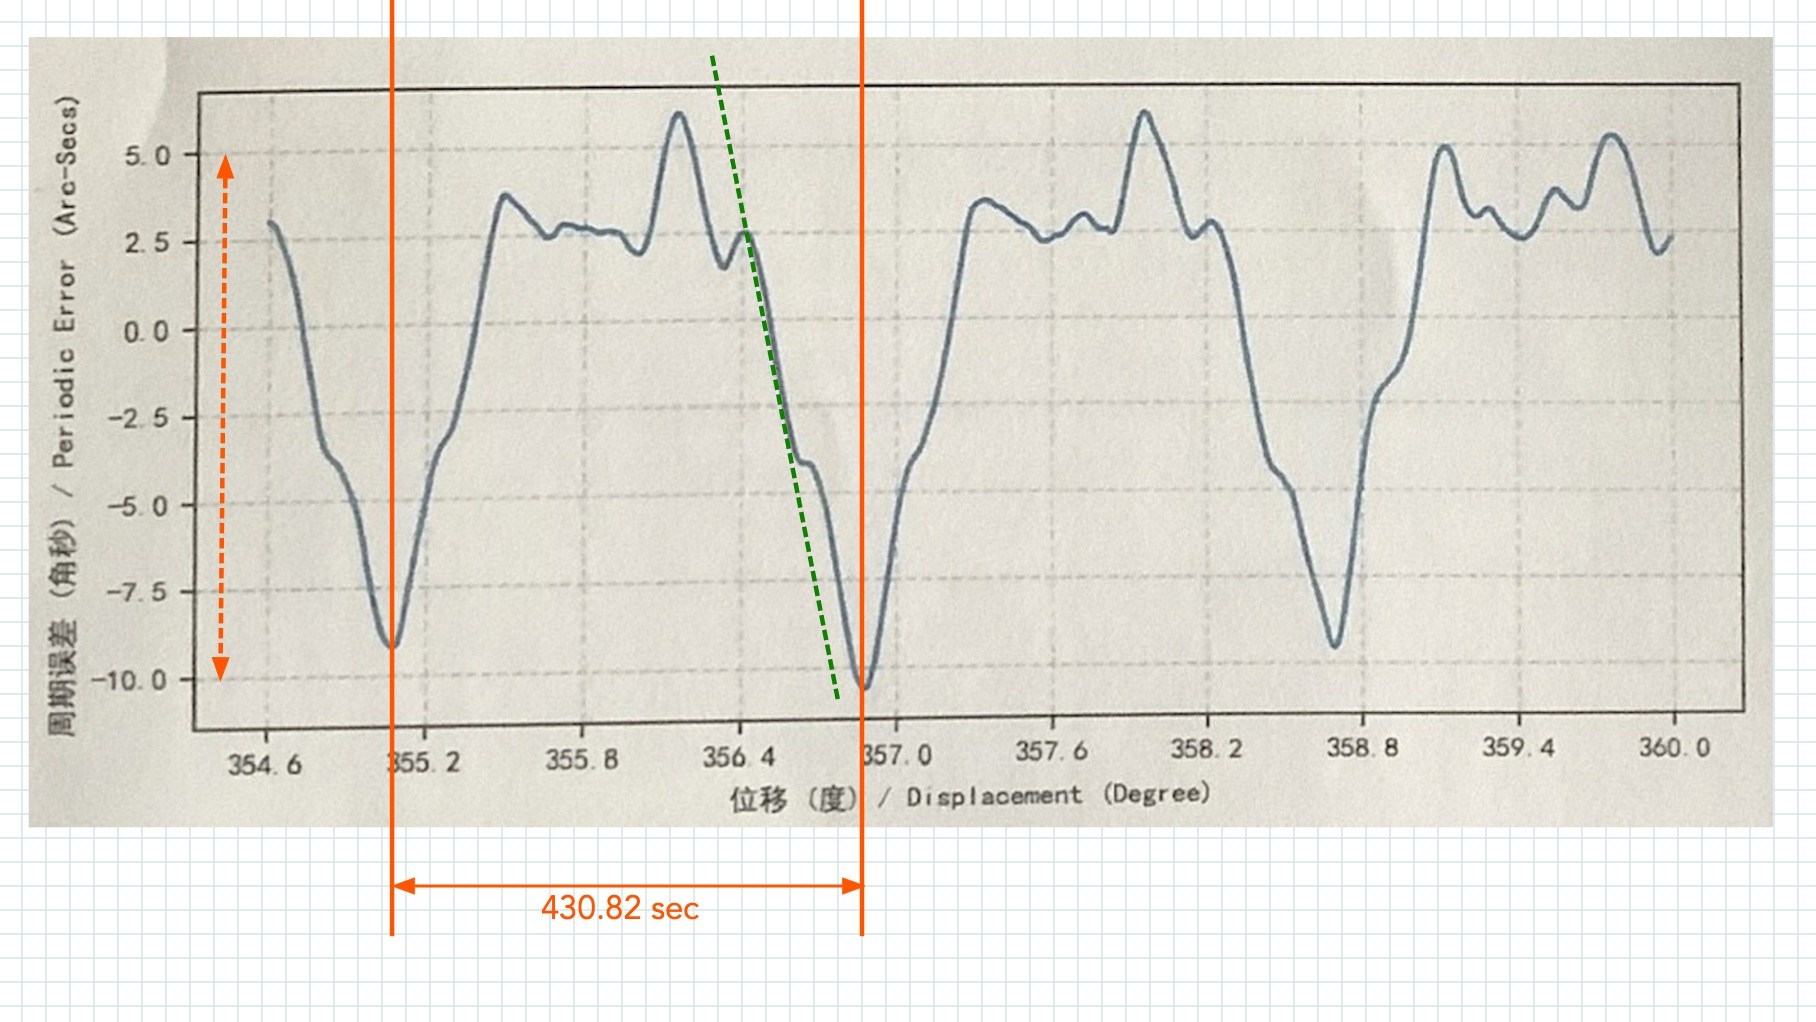
The scale (in degrees of the shaft) of the abscissa is not very useful for us, but we know that each cycle of the PE correcponds ro one sidereal day/200 (in the case of your mount; since they had tried to mimic the RainbowAstro RST-150h and RST-135). That is about 480.82 seconds, which I have drawn in red.
Now we try to eyeball some part of the curve that has the largest slope (just don't tell my engineering profs that I am winging it like this, or they would retroactively flunk me)...

The dashed green line is probably a good enough pick.
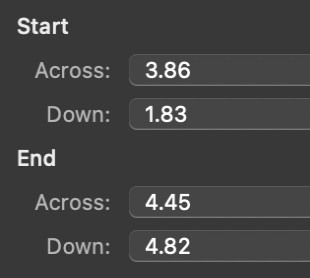
I am doing this using an application on macOS called EazyDraw, and it is nice enough to show the actual coordinates:

So we know the slope of that line is dy/dx = (2.99/0.59) = 5.07 in the EazyDraw units. To estimate real units, I took the distance between -10 arc seconds and +5 arc-seconds in the ordinate of the graph (dashed red line), and that came to 2.43 in the EazyDraw units. So we know that the vertical scale is 15 arc seconds per 2.43 EazyDraw units, or 6.17 arc-seconds/EazyDraw units.
Similarly, the distance between the 430.82-second lines is 2.18 EazyDraw units, so we know the scale of the abscissa is (430.82/2.18 ) = 198 seconds per EazyDraw units.
We had come up with a slope of 5.07 EazyDraw units, so applying these scales, we get voila, a worst case slope of ( 5.07*6.17/198 ) = 0.16 arc-seconds per second.
A perfect sine wave with 15 arc-second peak-to-peak amplitude would have given you a worse case slope of around 0.105 arc-seconds/second. So, indeed your mount has about what is called 60% total harmonic distortion (THD) in that waveform (the audio amplifier in your TV probaby has a THD of less than 0.1% :-). If this were audible, it would sound rather dissonant -- in fact, you can probably tell when you slew the mount that the sound is not like what you hear from a tuning fork [which is quite sinusoidal] :-)
If you want the peak error (from one axis) to accumulate less than 0.1 arc-seconds before applying a correction pulse, you will need to apply correction puses no longer than 1 per second. And, for PHD2 guiding, that means a guide exposure time no more than 1 second.
You have one of the better ZWO mounts. If you look at their documentation, you will find mounts that have much higher peak-to-peak error than the 15 arc-seconds in your mount. Here is a sampling from their documentation:
https://astronomy-imaging-camera.com/wp-content/uploads/all-kinds-of-periodic-errors.jpg
The one on the top right has a peak-to-peak PE that is almost three times your mount's p-p PE. For people who have those mounts, they would need more correction pulses per second than you do.
However, the devil is in the details. ZWO did not show the per-cycle curve, so we don't know the actual harmonic content.
They do have a picture that showed this:

Notice that the worst case slope looks worse than yours too. And if you stare closely at the scales, it looks like the p-p error is perhaps around 30 arc seconds (much worse than yours, unless the "partial zoom" plot for your mount came from a favorable part of the 360º travel). So, compared to your mount, that particular mount would be harder to guide and would need guide corrections in the 2 per second (0.5 second exposures) region to get anywhere close to 0.5 arc-second total RMS.
With care, and studying and understanding your mount, you can auto guide these strain wave mounts. You just can't use some lazy "what is your settings because I want to copy it" method, because the characteristics are so different from mount to mount that comes off the same assembly line.
So, please folks, don't use the numbers that are derived above if you are not @Kevin_A.
I can get better than 0.5 arcsecond total RMS error with my RST-135, and at times, when the gears are at the smooth part of the curve, I would get 0.25 arcsecond total RMS type guiding. In my case, I use 0.5 second guide exposures, and set my max RA and max declination durations in the 130 ms to 180 ms region (forget the 1000ms to 2000ms nonsense, folks), and setting aggressiveness down in the 35% to 45% region. But not even all RST-135 are alike. I have two RST-135, and they are not alike.
Chen