• ASI Mount
  • Getting the best performance from my AM5

raawe I did mine, absolute worst case is 0.228 arcsec/sec (violet line)

As mentioned multiple times already on this thread, just set the max RA pulse duration to give this much movement for the gude rate that you use. Nobody knows your guide rate, so no one can give you any number.

Chen

Looking at that PE trace made me think again. All the HD mount guide logs I have seen show short duration, large spikes in RA - even when guiding well. I wonder if these are actually at the point in the PE curve where the error reverses? In the case above this means the error rate goes from approx +0.23" per sec to -0.23" per sec virtually instantaneously - the peaks are sharp. Just a thought.

  • w7ay replied to this.

    Jhaunton In the case above this means the error rate goes from approx +0.23" per sec to -0.23" per sec virtually instantaneously - the peaks are sharp. Just a thought.

    They are probably not instantaneous -- just appears so when the curve is shrunk on a finite graph.

    The way to view it is to look at the periodic error curve as a Fourier Series. For good mounts, terms after the third harmonics are very small. For worse mounts, you may see large 5th, and even 7th harmonic terms.

    In any case, each of these components of the Fourier Series is a continuous function -- and since they are sinusoidal, the sign change occurs when the magnitude of the first derivative of the curve is small. I.e., you don't go from +0.23" to -0.23", you go through +0.2...+0.10, ... +0.8,... +0.1, 0, -0.1, -0.2, ... etc. And the slopes near 0 are easy to guide away.

    Mathematically, the second derivative (how fast the first derivative changes) is actually quite small. I.e., no sudden change in slope.

    Chen

    prastro It just works great. I took the data into Excel and calculated the first derivative. Then I generated an X-Y plot and obtained this:

    The blue line is the PE, and the orange one is the first derivative. So, the maximum slope is close to 0,3 arc-sec/sec.

    Thanks a lot for the tip.

      biomedchad Are you saying that AM5 can't do an autoflip with NINA / ASCOM? If so, thats not correct.

      fbitto Sure.

      Mine is similar. I get a max first derivative of 0.3 as/sec every 430 sec (surprise!), which lasts for about 20 sec.

      Interestingly, when I did it manually, I got 0.18-0.2 as/sec, but this is obviously much more accurate.

      Can this also be worked into the sub length, if we know, say, that the guiding will be under stress every 430 sec for 20 sec?

      Next step is to do it on the actual graph under load (PHD2 LogViewer) and not the unloaded ZWO chart.

        fbitto

        prastro

        Could I ask a favour and grab your excel formula to calculate the first derivative? Have pulled data from my ZWO report, got it in excel and duplicated the graph with data points.

        Whats the next step to get derivative values from existing 2 columns of data?

          @StarzLite forgot to ask you what kind of setup are you running? Main/guide scope mainly.

          ShinyredAM5 You have to divide two consecutive values of the error (y axis) by two consecutive values of the time (x axis).

          But the time axis is calculated from the displacement in degrees. To do that you'll have to multiply all the values in degrees by 239,3444 (430,82 sec per cycle divided by 1,8 degrees per cycle)

          In cell E3 the formula is =+(D3-D2)/(C3-C2), and so on.

          Then you can just look at the values in column E or use the formulas =MAX(E:E) and MIN(E:E) to obtain the maximun and minimum slope values

            Going to chime in and thank Chen and a lot of other people I've gleaned info from the past two weeks. First night out on the AM5 a couple of weeks ago I was averaging .87 RMS total and was completely amazed by that. Coming from a GEM28 I thought I would never regularly see >1"RMS. But after reading/applying some of the recommendations and tweaking the RA/Dec aggression (40/40, I know going lower would lower RMS even more so looking forward to that test), I was able to stay at .59" RMS total last night for over 3 hours. Equip is as follows: AT80EDT main scope, 60mm guidescope, 533MC main, 290mm guide, ASIAIR Plus and AM5. I set the Calibration step to 900ms (per PHD2 recommendation) and RA Dec duration to 200ms with a .5s capture.

            When it's a bit warmer I'll do some more tests but I'll take .59 any night of the week. Question on binning. I've seen bin2 recommended before on guiding with my GEM. Would it help or hinder in this case? Apologies in advance if that's been addressed above

            Finally some nice weather so I put those new numbers to the test. Was really conservative with the settings for the first run. Results are amazing. Max RA and Max DEC was set to 250ms and aggression to 35/45%, but I feel this can go even lower. Total RMS was dancing around 0.3" and was maintained for the duration of my imaging session (3h).

            I was using Askar FRA500 at native f/5.6. Off-axis guiding with ASI 290MM mini and main cam is ASI2600 MM Pro.

            A big thank you to everyone's suggestions.

            fbitto

            Thank you for the formula, just finished off the excel graph and its interesting stuff.

            Seems my mount spikes at 0.3 arc secs / sec worst case but mainly sits around the 0.2 level.

            fbitto In cell E3 the formula is =+(D3-D2)/(C3-C2), and so on.

            What about if you are on line D15 or D33? Is there a generic formula that can be used to cover all D values? I am an Excel dummy.

              tempus

              If you start the formula at the same place then you can copy and paste, important thing is that the formula will reference the same cells.

              If for any reason you are not using exactly the same cells to start - then you can delete the 'D3-D2' and click each cell you want to use instead, likewise for 'C3-C2'. Important thing is that your formula references the same pattern of cells as given in the example earlier in this thread.

              If you don't fancy the excel method, Chen's method is accurate enough for sure.

              If you don't mind using GNU Octave (a free alternative to MATLAB), you can use a script similar to this:

              `clear

              format long g

              x = csvread('C:/Users/XXXXXXX/Downloads/Default_Dataset.csv');

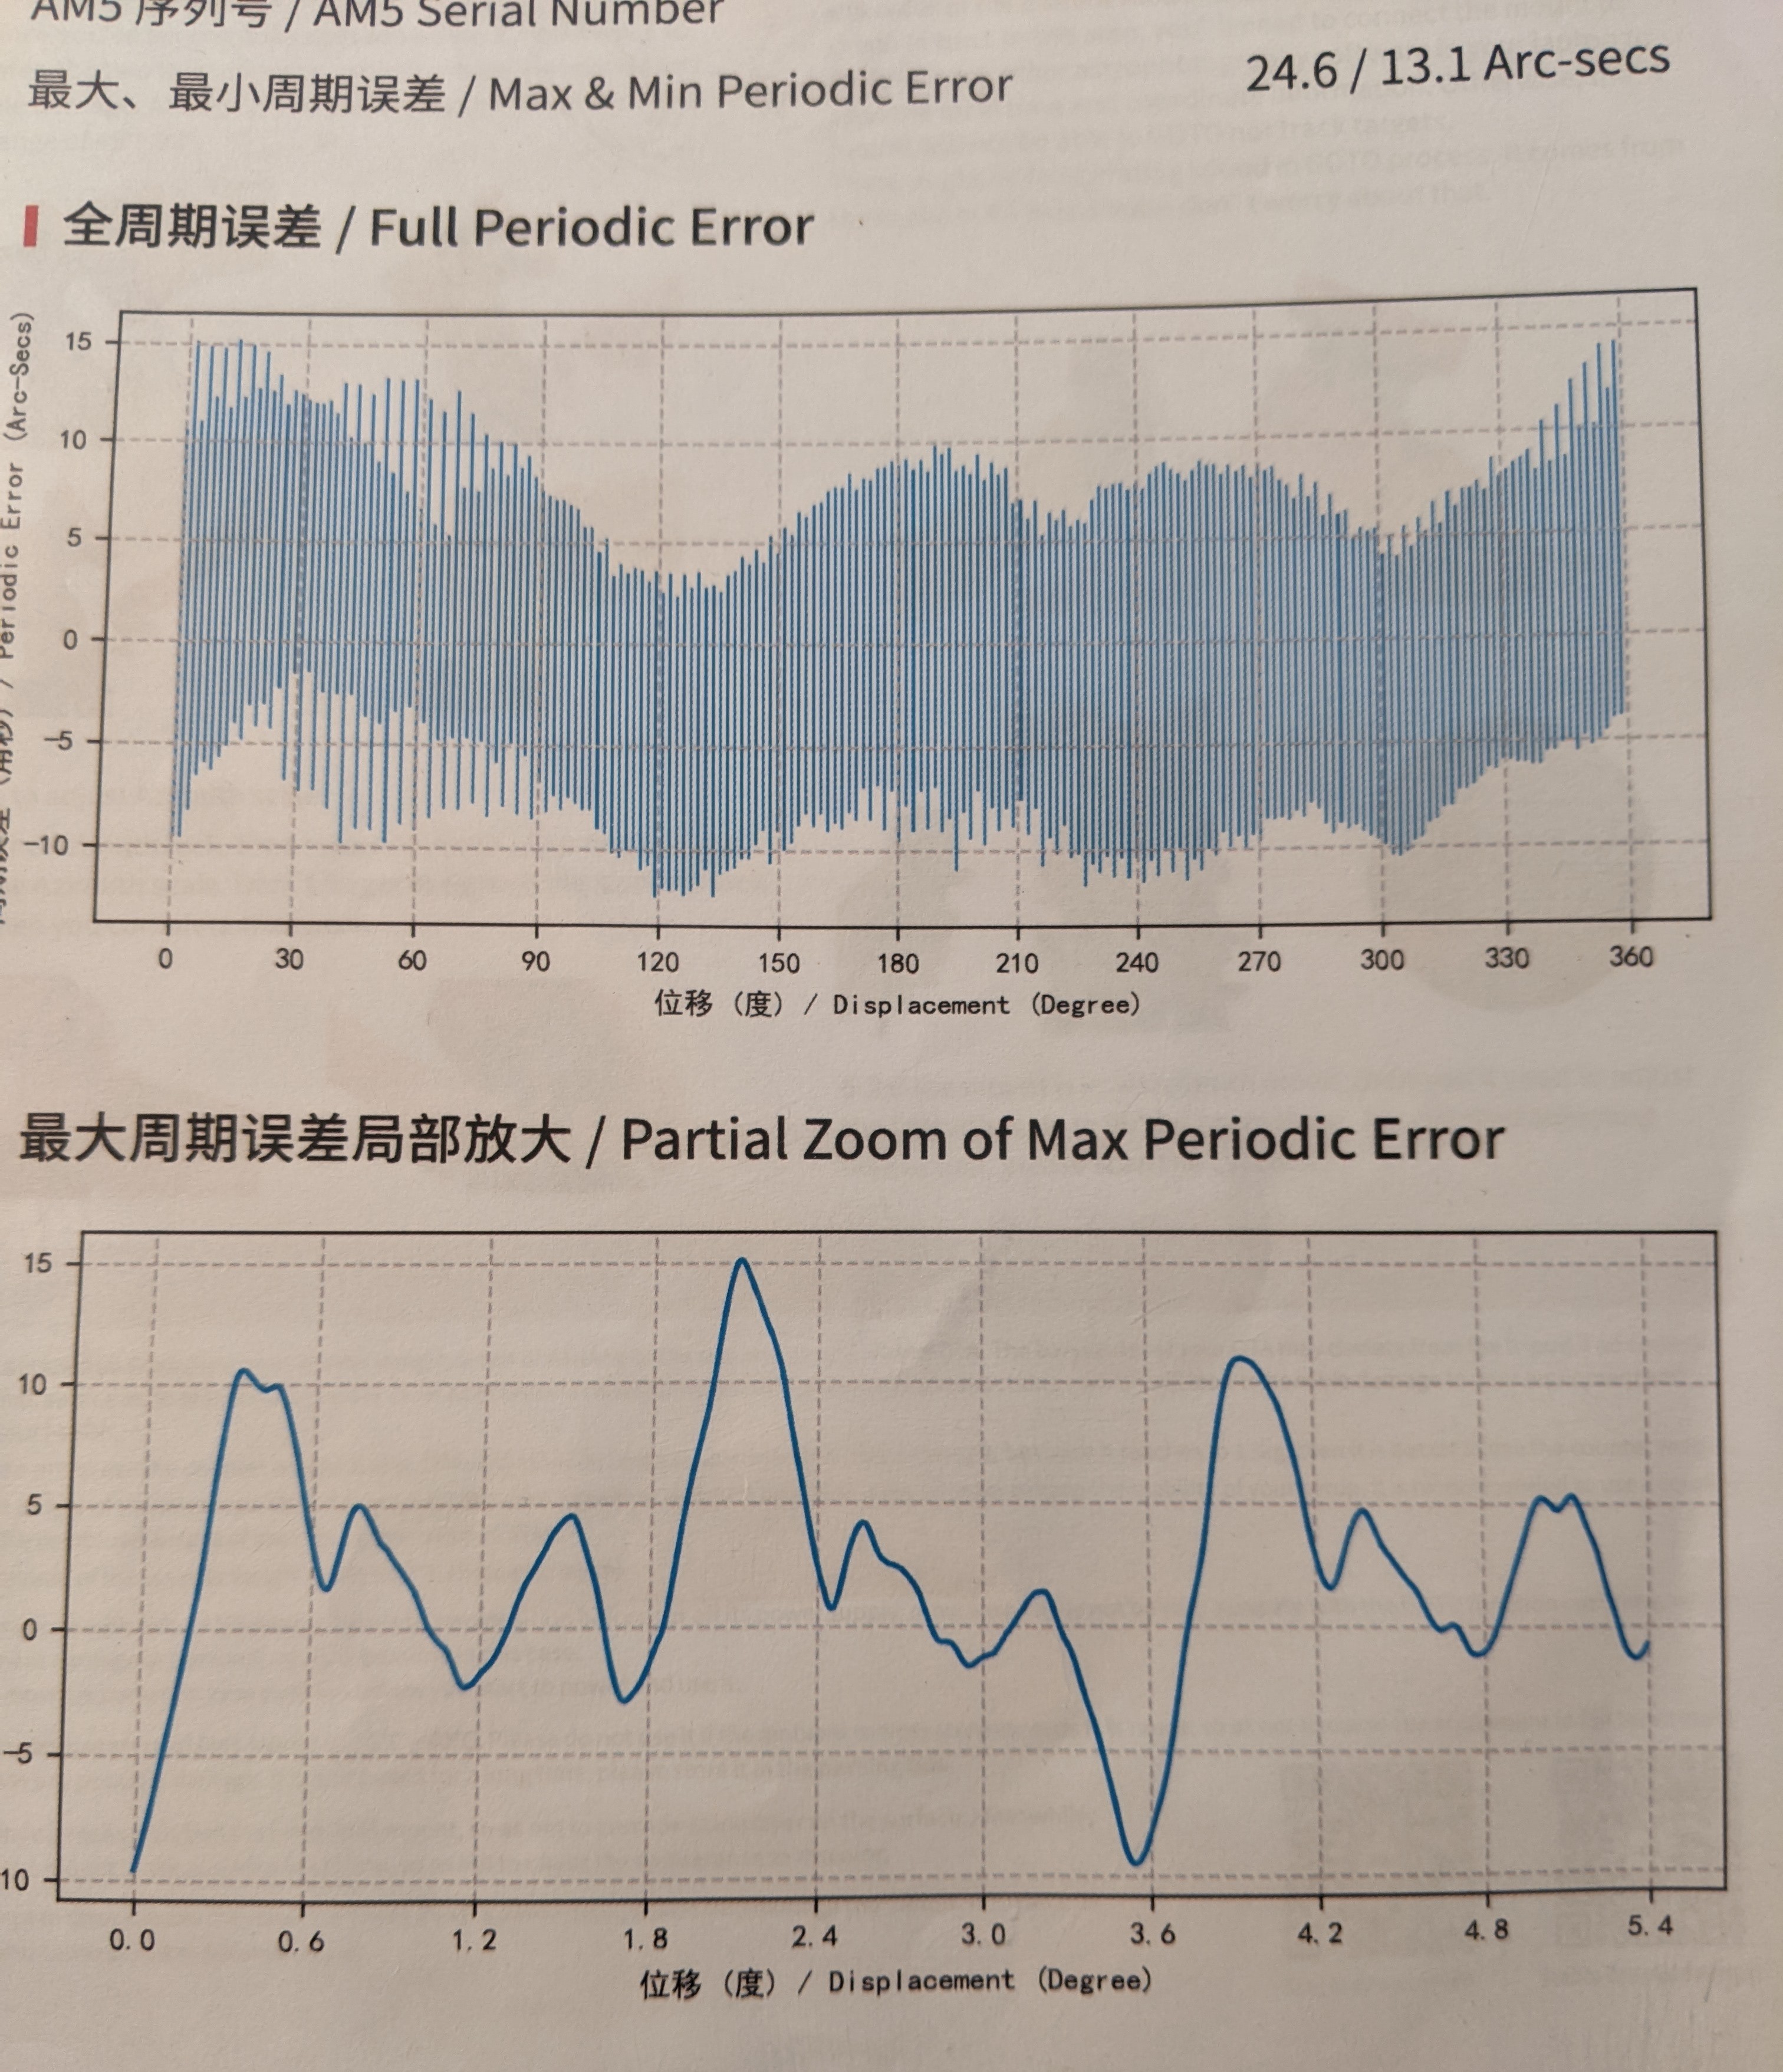
              #Change the following values according to your guide settings and AM5 PE chart
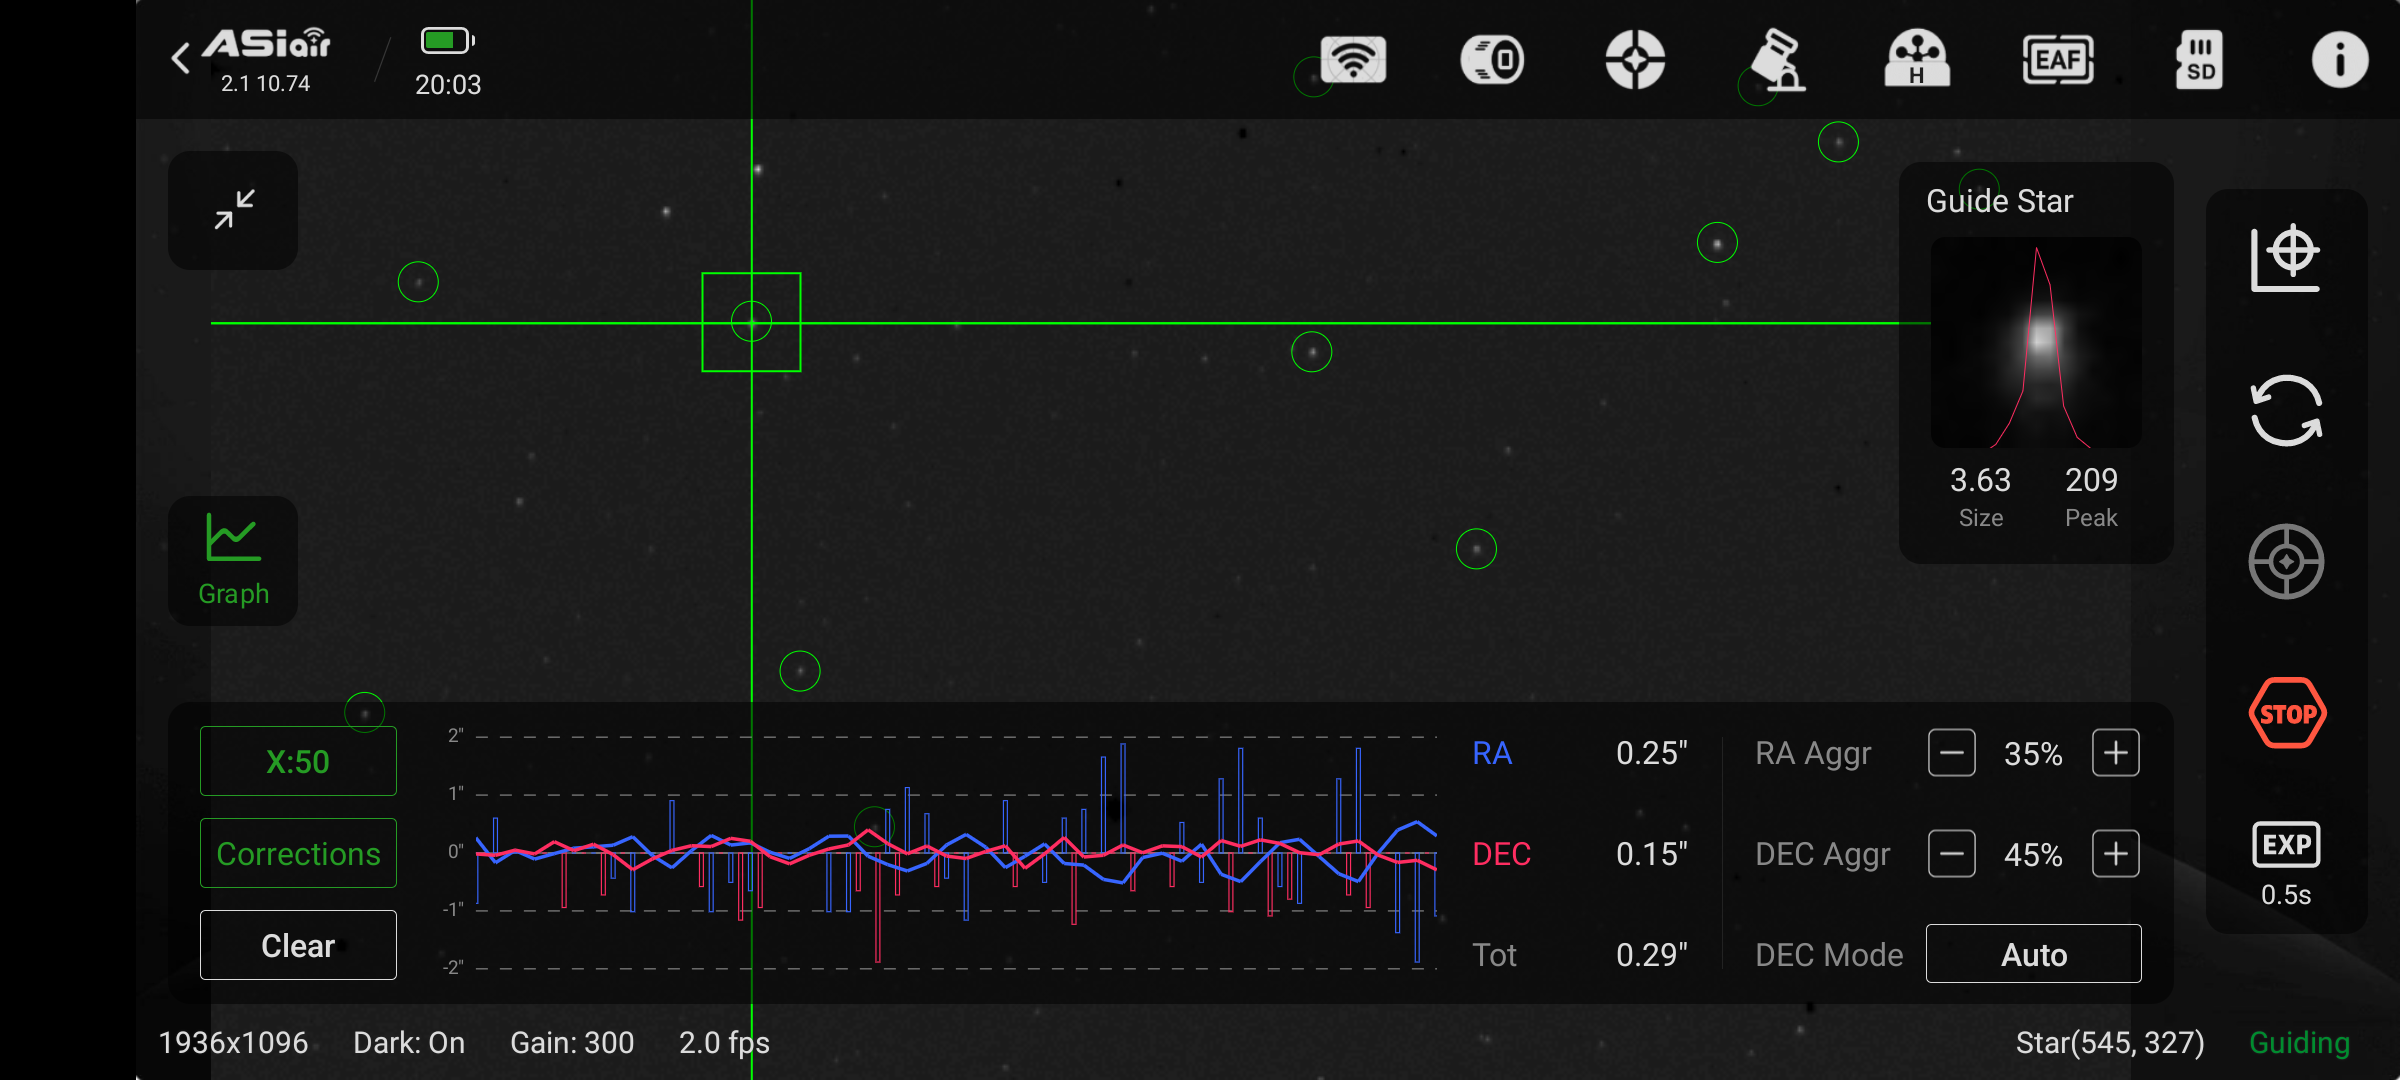
              guide_rate = 0.5 # 0.5X, 0.9X, etc.
              PHD2_sec_per_frame = 2 ;
              Xo = 129.60 #degrees at left side of chart (not needed really because we are interested in differences)
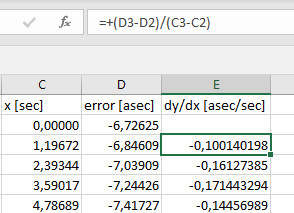
              deg = x(:,1);
              err_asec = x(:,2);

              t = (deg-Xo)*(430.82/1.8); #convert degrees to seconds of time

              dt = diff(t);
              de = diff(err_asec);

              deri = rdivide(de,dt); #divide each element of the de matrix by the corresponding element in the dt matrix

              max_slope_pos = max(deri);
              max_slope_neg = min(deri);

              max_slope = max(abs(max_slope_pos),abs(max_slope_neg));

              asec_guide_rate = 15.0 * guide_rate / PHD2_sec_per_frame

              max_AR_pulse_ms = max_slope/asec_guide_rate * 1000;`

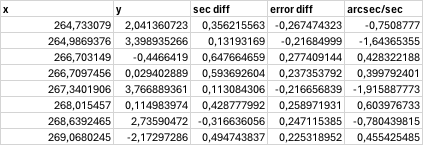
              Where the Default_Dataset.csv file has the data obtained from WebPlotDigitizer.

                @w7ay Chen, thank you for analyzing and prescribing the method to improve guiding for these Strained Wave based mounts. Your suggestion to limit the length of the each guide pulse makes sense because of the extreme short and frequent guide corrections.

                I can add a few tips to help determine each mount's PE slope by using the app PHD2 log viewer. Based on my mount's performance, I deduced that

                1) you cannot trust ZWO's PE curve shipped with each mount. Mine was said to have 24.6/13.1 arc-sec max/min, but the actual measured data for my recent guiding session points to a max 40 arc-sec. Yes, this max error is really bad, but at least the higher harmonics are relatively tamed.


                2) the period of the drive error is around 400 seconds. It is quite consistent that I believe we can leverage PHD2's predictive algorithm to proactively reduce these errors.

                3) this app is really easy to use and has an intuitive GUI for zoom in and out to measure the slope of the error.

                Kai

                  This graph is a longer sampling of my mount performance. The chopped top for one of the peak was my attempt to remove a dithering move.

                    Hi,kaiyung
                    Can you please check the SN code on this paper and one on the AM5 body?
                    Are they exactly the same value?